
Dashboards
Lumeo Dashboards are flexible, multi-modal dashboards that make it easy to visualize video and analytics data for security, business and operational insights.
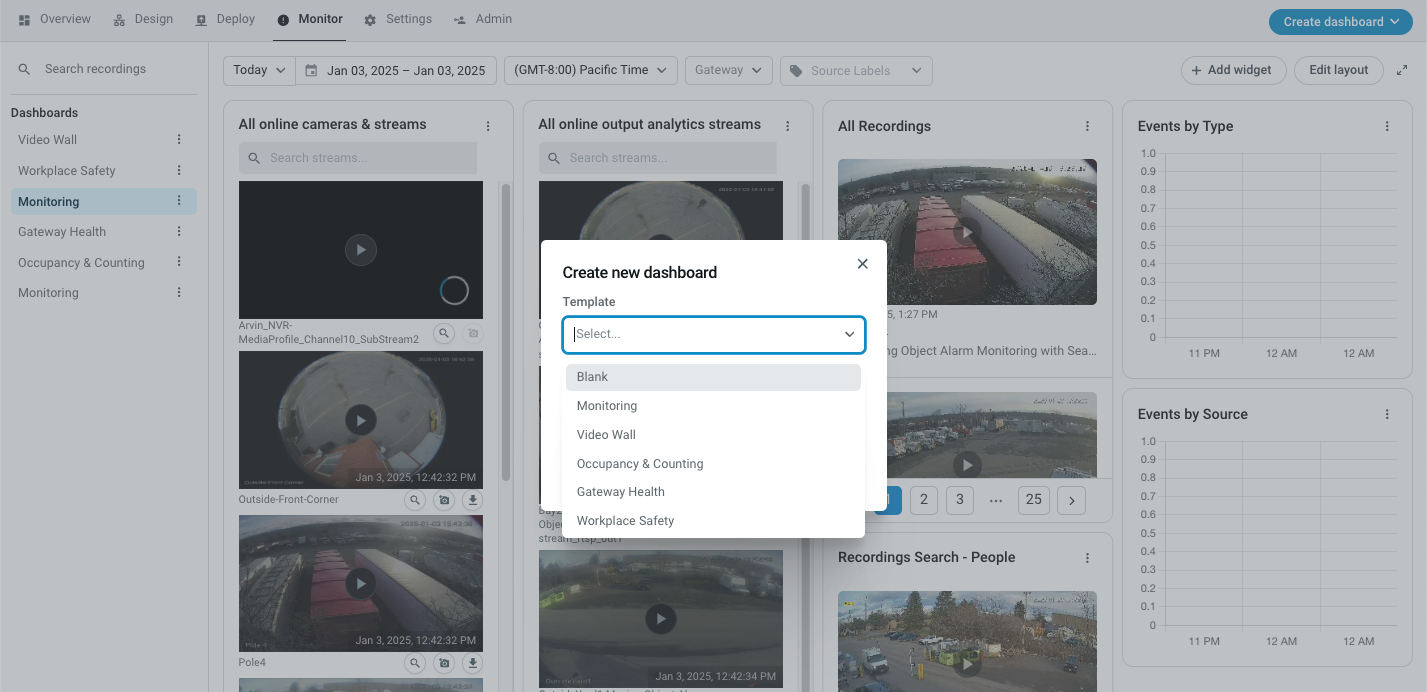
Creating a Dashboard
Plan RestrictionsThe Starter Plan comes with the ability to create 1 Dashboard. Business & Enterprise Plans can create Unlimited Dashboards.
Start by creating a Dashboard using the "Create Dashboard" button on the top right menu. You can create a blank dashboard, or pick from a range of dashboard templates available to get started.
Tip: If you have deployed pre-built analytics templates, refer to the analytic template description for corresponding Dashboard templates that work with the analytics you have deployed.
Once created, you can Rename, Duplicate or Delete the Dashboard using the context menu in the Dashboard list in the left navigation.
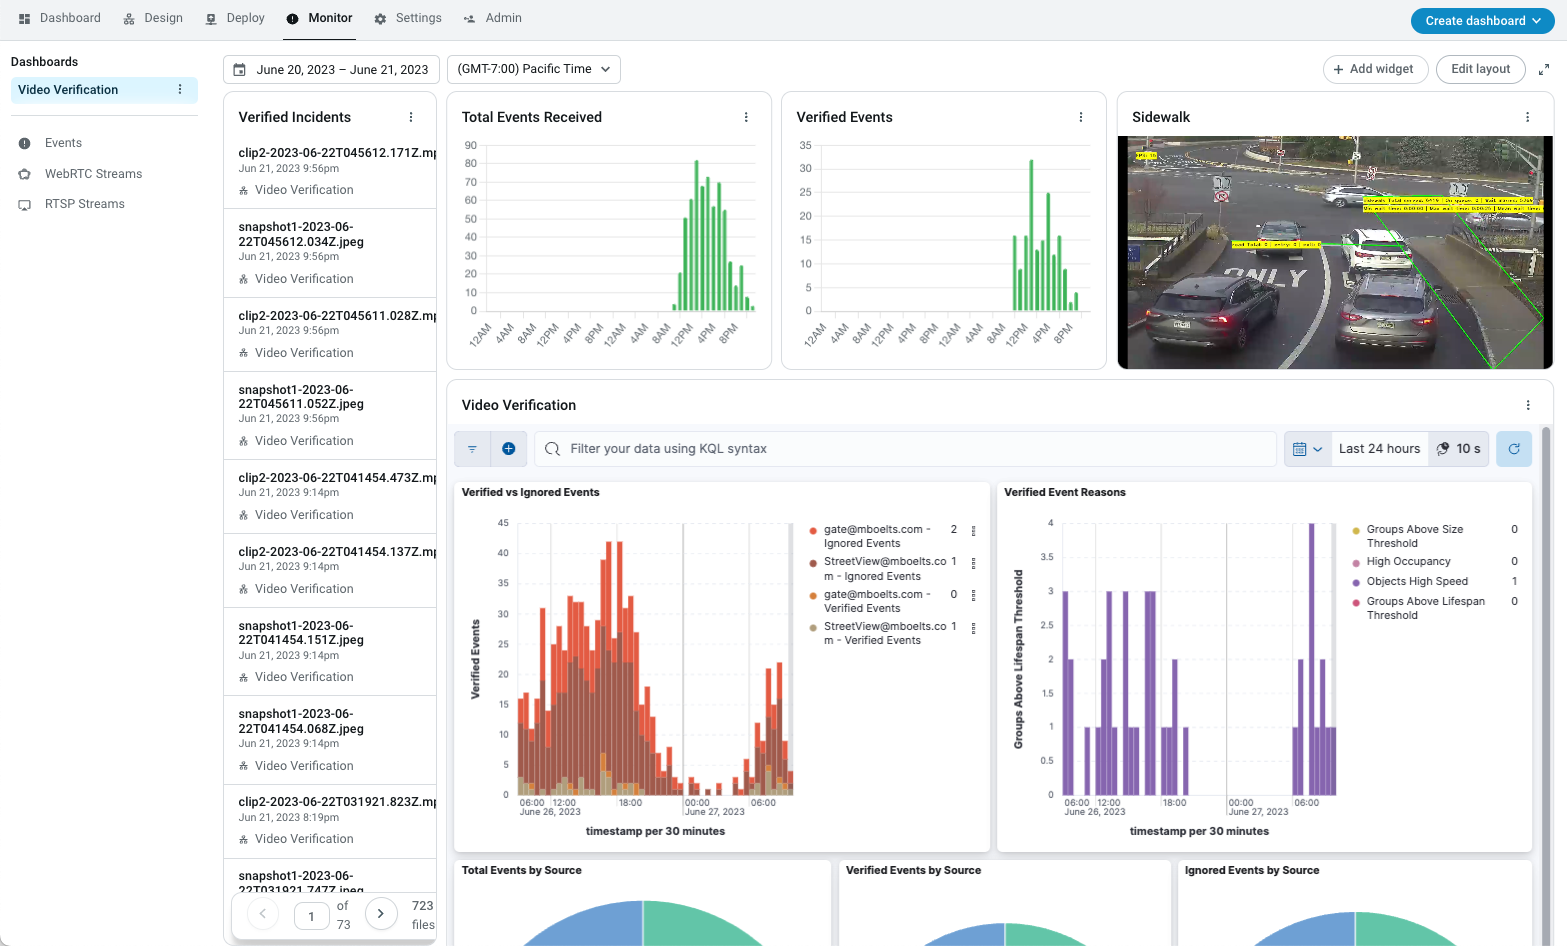
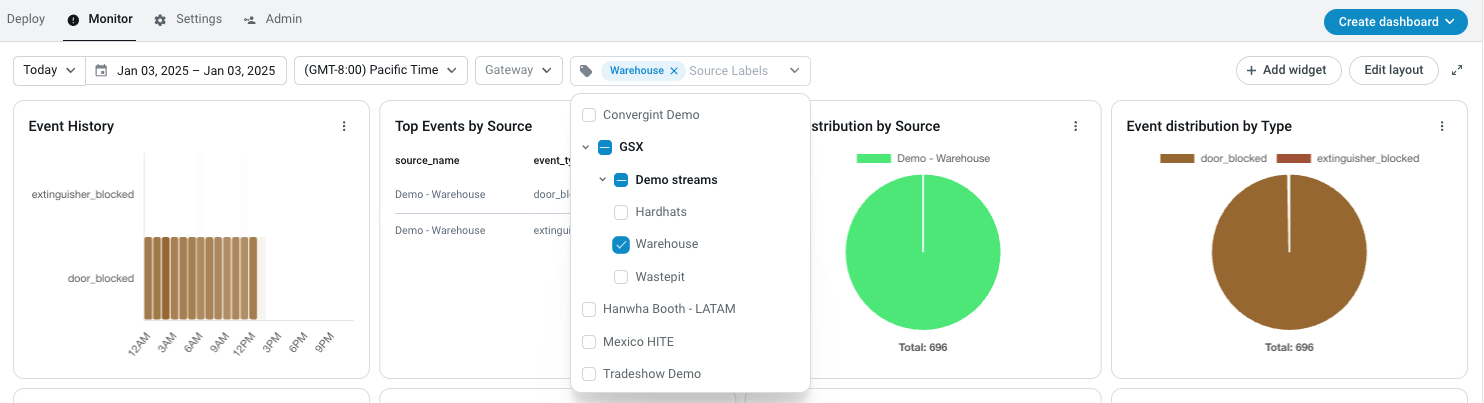
Filtering dashboard data and media
All the data in a Dashboard can be filtered by one or more of these attributes:
- Time : Select a start date and end date, a particular timezone or a preset to filter by time
- Gateway : Select a gateway to filter data to that generated by a specific Gateway
- Source Labels : Select a Label to filter data to that generated by analytics running on sources that are tagged with that Label or it's descendants. You can create labels and tag sources under the Deploy section. This is a very powerful capability since it lets you visualize a single Dashboard by your custom hierarchy (such as by Region, Customer or Area).
Widgets
Each Dashboard consists of Widgets that you add and configure.
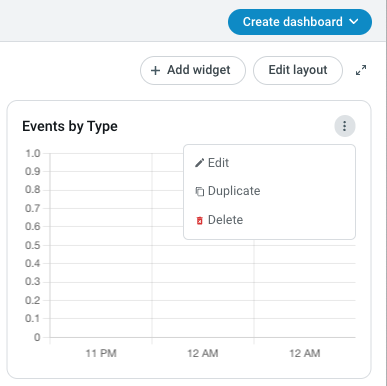
Widgets can be resized and dragged to create the perfect layout using the "Edit Layout" button on the Dashboard.
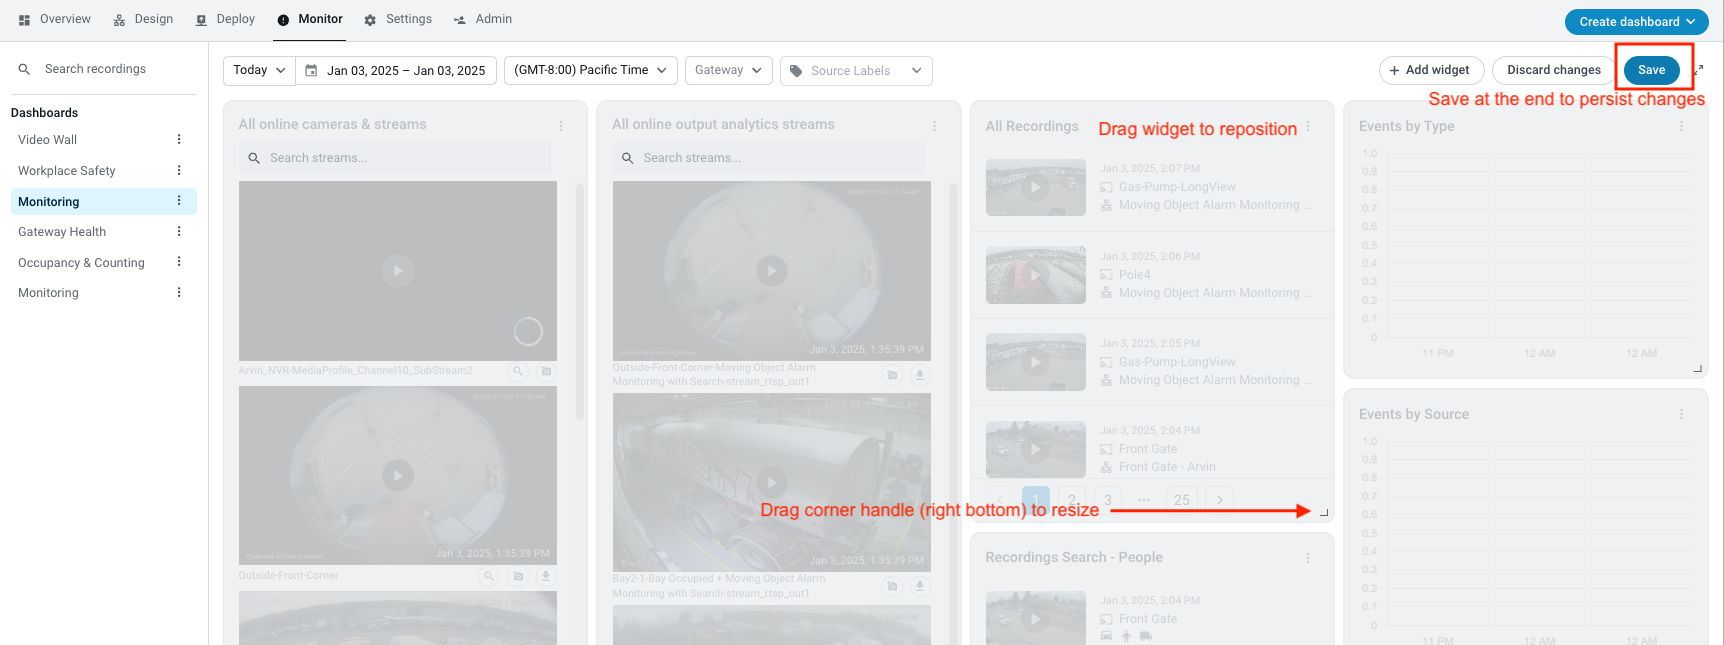
Widget properties can be updated from the Widget context menu. You can easily Duplicate or remove widgets from here as well.
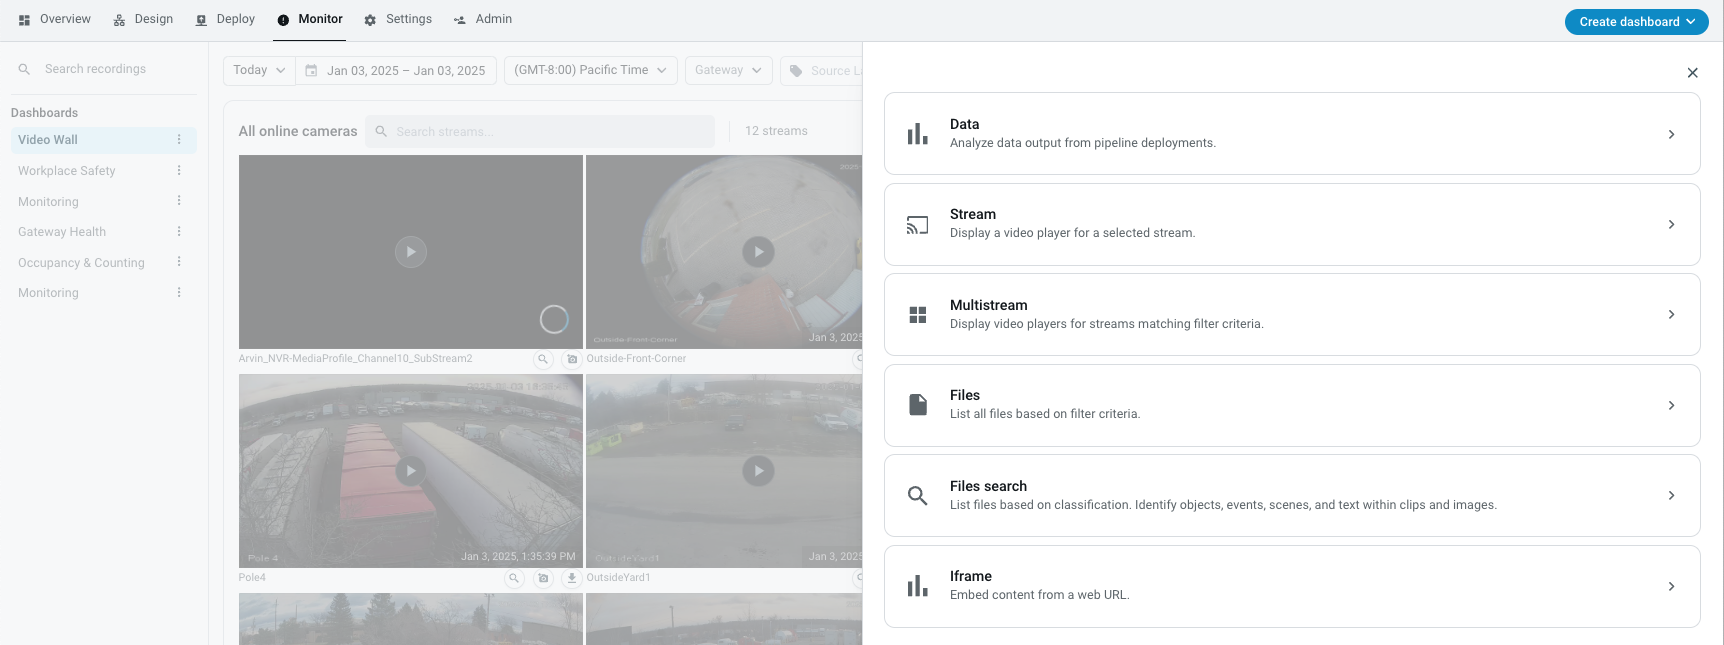
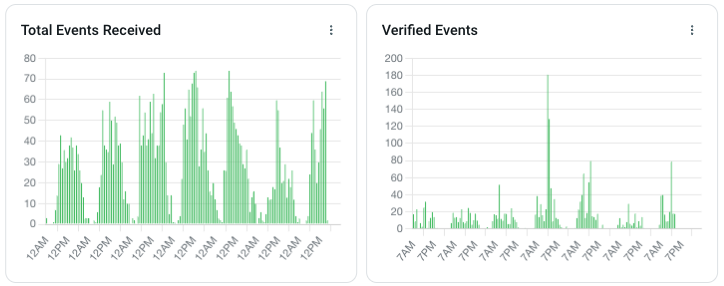
Data
A Data widget visualizes analytics metadata that has been published from a Pipeline using a Publish to Lumeo Dashboard Node.
Plan RestrictionsThe Publish to Lumeo Dashboard node that is needed to publish data for this widget is available only on Enterprise Plans.
Publish to Lumeo Dashboard Node Configuration
The Publish to Lumeo Dashboard Node can publish 3 types of metadata to the Dashboard. See Node documentation for how to configure it.
| Metadata Type | Description | When to Use |
|---|---|---|
Node Metadata |
This includes Node-specific metadata such as Line Counter Node's line crossing metadata or Occupancy Monitor node's occupancy metadata. Refer to Node's documentation for information on what metadata is published to the Dashboard. |
Use it to publish Node-specific stats such as line crossings, or occupancy numbers. |
Object Attributes Metadata |
This includes object types and object attributes that are added to an object by AI Model Node or specific Recognition nodes. |
Use it to capture and display attributes (such as license plate numbers, vehicle types, barcode values, colors, etc.) Note that if you are just trying to count object attributes you are better served by using the Node Metadata instead of publishing Object Attributes. |
Event Metadata |
This publishes an event to the Dashboard (ex using a Trigger an Event node) every time specific Trigger Conditions are met. |
Use it to publish counts of custom events that are not already being published by Node metadata -- such as a car making an illegal left turn. |
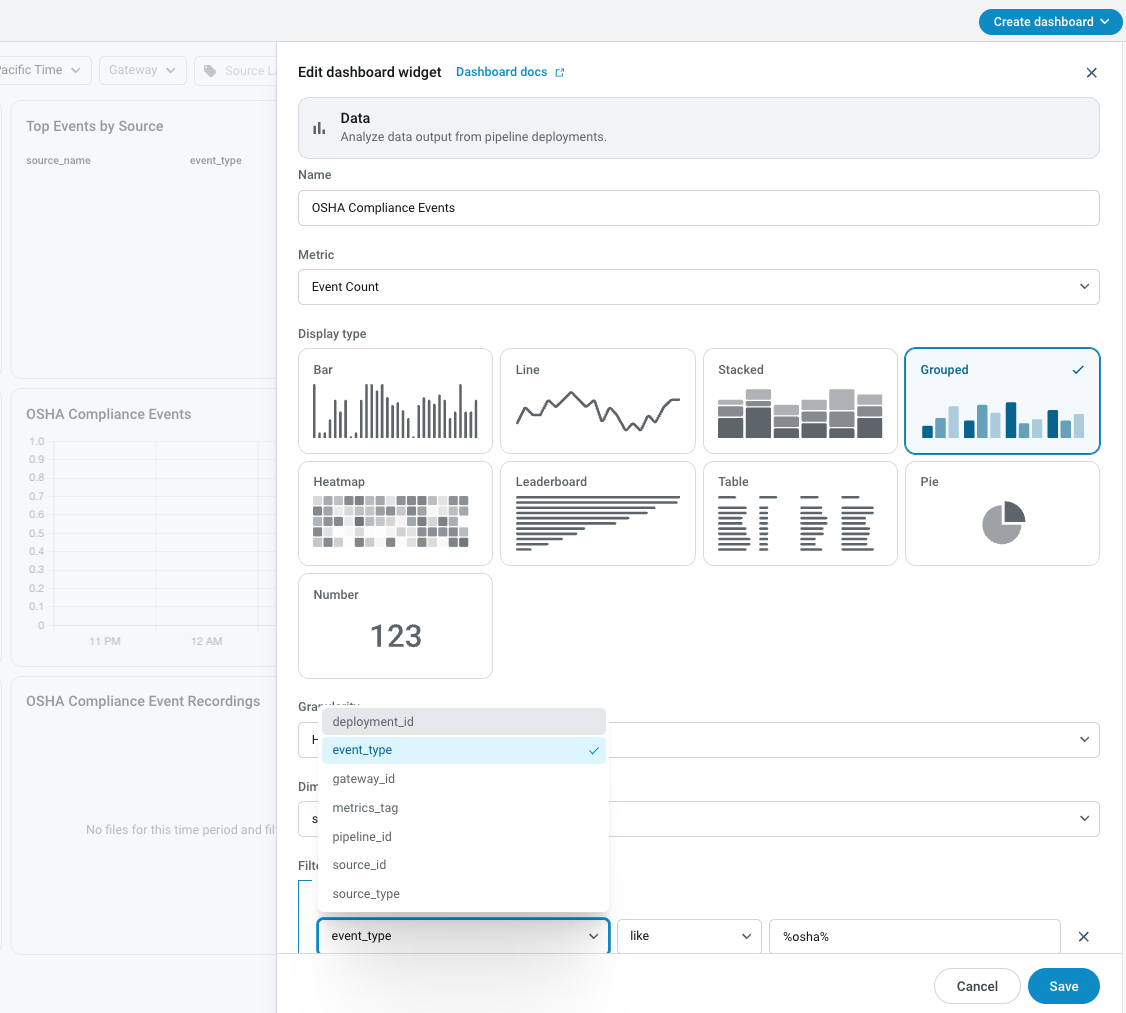
Visualization Options
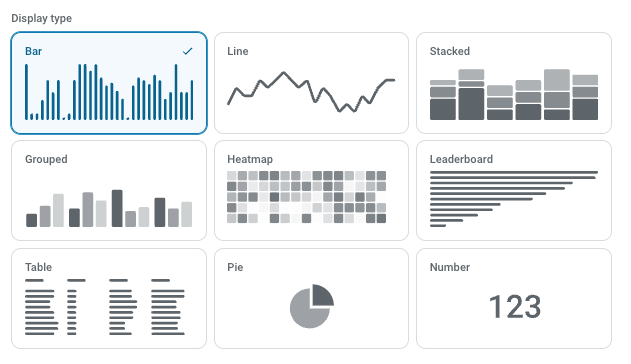
The Data widget offers the following visualization options:
| Configuration Option | Option Value | Description |
|---|---|---|
Metric |
Event Count |
Count the number of Events published using the Event Metrics properties of the Publish to Lumeo Dashboard node. |
Object Attribute Count & Object Attribute Count (Distinct) |
Count the number of Object attributes published using the Object Attribute Metrics properties of the Publish to Lumeo Dashboard node. |
|
Node Records Count |
Count the number of Node Metrics published using the Node Metrics properties of the Publish to Lumeo Dashboard node. |
|
|
<Node Specific Metadata Aggregations>
ex.
Occupancy : Object Entered Sum Line Counter: Total Objects Crossed Sum |
For each supported Node type, a Metric that aggregates specific node data is listed here. Typically, this is used along with a Metric-specific Dimension or Filter, with suggestions available in those dropdowns. |
|
Display Type |
Bar |
|
Line |
||
Stacked Bar Chart |
||
Grouped Bar Chart |
||
Leaderboard |
||
Heatmap |
||
Table |
||
Pie |
||
Number |
||
Granularity |
HOUR, MINUTE, DAY, MONTH, FIVE_MINUTES, FIFTEEN_MINUTES |
Time granularity to use for Time displays (Bar, Stacked Bar and Line). |
Dimensions |
Common: Source ID, Source Name, Gateway ID, Gateway Name, Pipeline ID, Pipeline Name, Deployment ID, Deployment Name, Source Type, Metrics Tag Metric-specific Dimensions (such as Line Label, ROI Label, Event Type) |
Series values to use for Stacked Bar, Leaderboard and Table displays. |
Row Limit |
Numeric. Ex. 10 |
Maximum number of rows/series values for Stacked Bar, Leaderboard, Table displays. |
Sort |
Ascending, Descending |
Sort order to use |
Filters |
Common: Source ID, Source Name, Gateway ID, Gateway Name, Pipeline ID, Pipeline Name, Deployment ID, Deployment Name, Source Type, Metrics Tag Metric-specific Filters (such as Line Label, ROI Label, Event Type) |
Filter the metadata being displayed using these conditions to limit to a specific source, pipeline, line, ROI or Metrics Tag. |
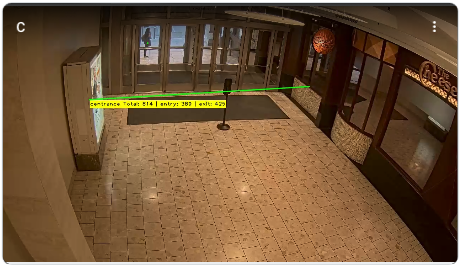
Stream
Stream Widget displays a RTSP or WebRTC stream output from a pipeline with a Stream RTSP node or Stream WebRTC Node.
| Configuration Option | Option Value | Description |
|---|---|---|
| Stream ID | WebRTC streams and RTSP streams | Pick the stream to display. |
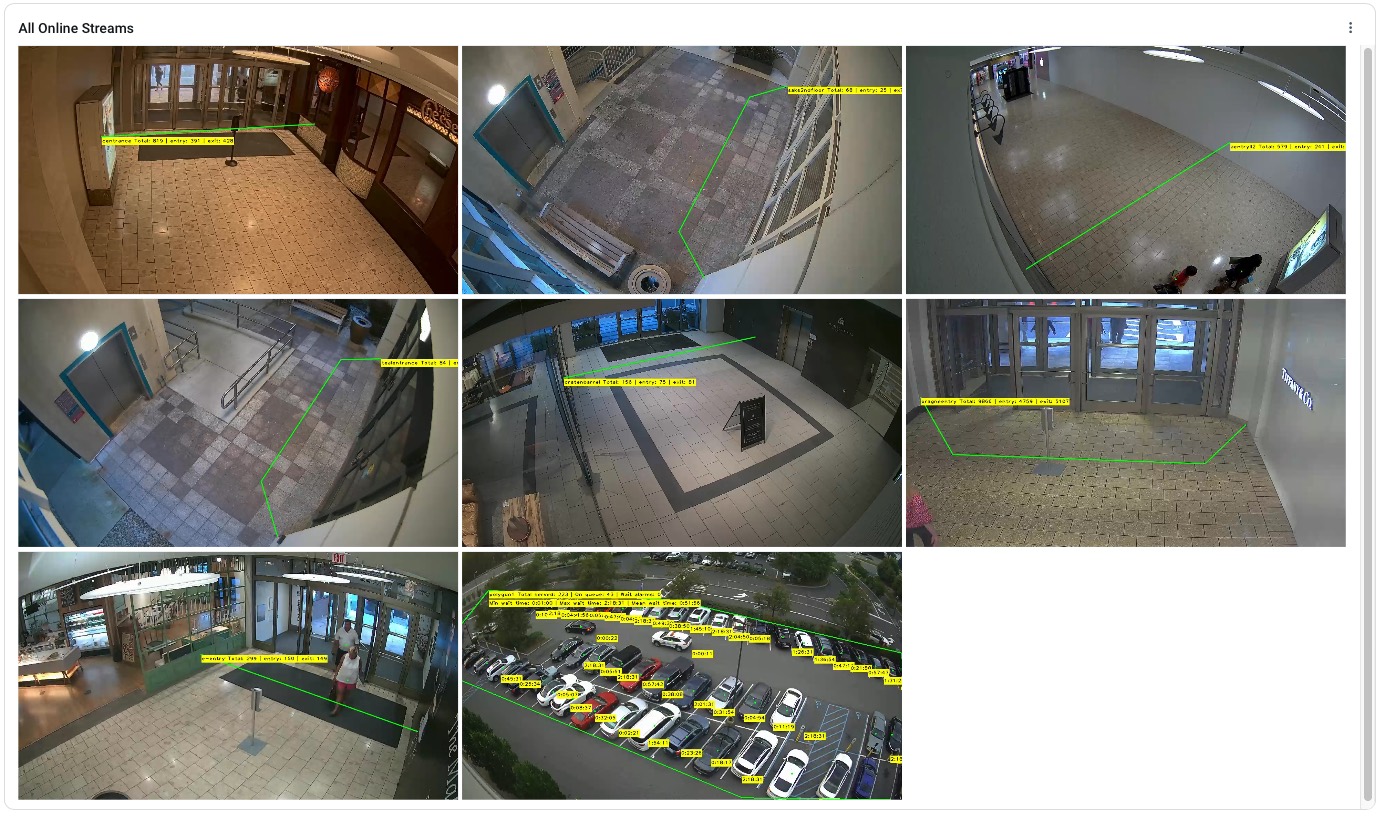
Multi Stream
Multistream Widget displays WebRTC streams output from multiple pipelines, chosen with a filter criteria. It is useful when you want to build video walls without having to manually add each Stream.
| Configuration Option | Option Value | Description |
|---|---|---|
| Show Online Streams Only | True/False | If True, only display online WebRTC streams. |
| Filters | Gateway ID | Display WebRTC Streams being processed by the specified Gateways. |
| Deployment ID | Display WebRTC Streams output by specified Deployments. | |
| Stream ID | Display WebRTC Streams specified by these Stream IDs | |
| Stream name | Display WebRTC streams whose names contain specific text. |
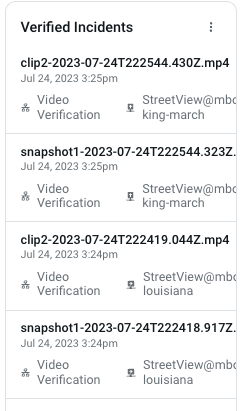
Files
Files Widget displays recordings generated by Save Clip Node and Save Snapshot Node that match a specific filter criteria, making it easy to shortlist files for review. For each file, the widget displays the Pipeline and Source that generated the file.
Clicking on a file in the Files widget plays it immediately in the browser.
| Configuration Option | Option Value | Description |
|---|---|---|
| Filters | Gateway ID | Display files captured on these Gateways |
| Deployment ID | Display Files generated by these deployments | |
| Stream ID | Display Files generated by these input streams | |
| Pipeline | Display Files generated by these Pipelines | |
| Node IDs | Display Files generated by these nodes within a PIpeline | |
| Camera | Display Files generated by these Cameras |
IFrame
Iframe Widget displays a web page inside an IFrame. It is useful to display external data or reports, say from an external BI system, within Lumeo for a single pane of glass.
Custom Dashboard Creation Guide
The guide below shows you how to build an analytic and a custom dashboard that goes with it.
Updated 11 months ago