
Observability & Metrics
Lumeo Metrics allows you to monitor and track resource utilization on gateways by exporting them via OpenTelemetry.
Background
Lumeo Gateways can export host and performance metrics, and Events using OpenTelemetry.
Enterprise Add-On FeatureMetrics export is available via an Enterprise Add-on.
Available Metrics
Gateway Metrics
Device-specific metrics.
| Name | Description | Unit | Attributes | Instrument type | Notes |
|---|---|---|---|---|---|
| system.cpu.load_average.15m | |||||
| system.cpu.load_average.1m | |||||
| system.cpu.load_average.5m | |||||
| system.cpu.time | |||||
| system.disk.io | |||||
| system.disk.io_time | |||||
| system.disk.merged | |||||
| system.disk.operation_time | |||||
| system.disk.operations | |||||
| system.disk.pending_operations | |||||
| system.disk.weighted_io_time | |||||
| system.filesystem.inodes.usage | |||||
| system.filesystem.usage | |||||
| system.memory.usage | |||||
| system.network.connections | |||||
| system.network.dropped | |||||
| system.network.errors | |||||
| system.network.io | |||||
| system.network.packets | |||||
| system.paging.faults | |||||
| system.paging.operations | |||||
| system.paging.usage | |||||
| system.processes.count | |||||
| system.processes.created |
Deployment Metrics
Performance metrics for each Pipeline Deployment that is running on the Gateway.
| Name | Description | Unit | Attributes | Instrument type | Notes |
|---|---|---|---|---|---|
| lumeo.deployment.run_time | Deployment run time | ms | - gateway_id - deployment_id - pipeline_id | Counter | |
| lumeo.deployment.input_frames | Frames produced by all input nodes | {frames} | - gateway_id - deployment_id - pipeline_id | Counter | |
| lumeo.deployment.output_frames | Frames consumed by all output nodes (Clip, Snapshot, WebRTC, …) | {frames} | - gateway_id - deployment_id - pipeline_id | Counter | |
| lumeo.deployment.restart_count | How many times the deployment has been restarted automatically | {restarts} | - gateway_id - deployment_id - pipeline_id | Counter | |
| lumeo.deployment.process.cpu.utilization | CPU utilization by deployment process | 1 | - gateway_id - deployment_id - pipeline_id - state : system | user | wait | Gauge | This metric duplicates process metrics, but it is easier to use if deployment ID is attached |
| lumeo.deployment.process.memory.usage | The amount of physical memory in use by this deployment. | By | - gateway_id - deployment_id - pipeline_id | UpDownCounter | |
| lumeo.deployment.process.memory.virtual | The amount of committed virtual memory by this deployment. | By | - gateway_id - deployment_id - pipeline_id | UpDownCounter |
Node Metrics
| Name | Description | Unit | Attributes | Instrument type | Notes |
|---|---|---|---|---|---|
| lumeo.deployment.node.frames_passed | Frames passed through the node | {frames} | - gateway_id - deployment_id - pipeline_id - node_id - node_type | Counter | |
| lumeo.deployment.node.frames_dropped | Frames dropped by this node | {frames} | - gateway_id - deployment_id - pipeline_id - node_id - node_type | Counter | |
| lumeo.deployment.node.latency | For how long this node processed the frame, in microseconds | us | - gateway_id - deployment_id - pipeline_id - node_id - node_type | Histogram | |
| lumeo.deployment.node.end_to_end_latency | (only for output nodes) Total frame latency from input to output | us | - gateway_id - deployment_id - pipeline_id - node_id - node_type | Histogram | |
| lumeo.deployment.node.clip.count_saved | Count of clips saved by this Clip node | {clips} | - gateway_id - deployment_id - pipeline_id - node_id | Counter | |
| lumeo.deployment.node.snapshot.count_saved | Count of snapshots saved by this Snapshot node | {snapshots} | - gateway_id - deployment_id - pipeline_id - node_id | Counter | |
Configuration
Metrics can be exported using OTLP HTTP or OTLP GRPC protocol.
To configure, head to Settings -> Metrics section in Console. Then configure the endpoint that will receive the metrics, and the corresponding headers / authentication details. You will find the values in your observability software.
These settings will apply to all the Gateways in this workspace.
OTLP HTTP Endpoint Configuration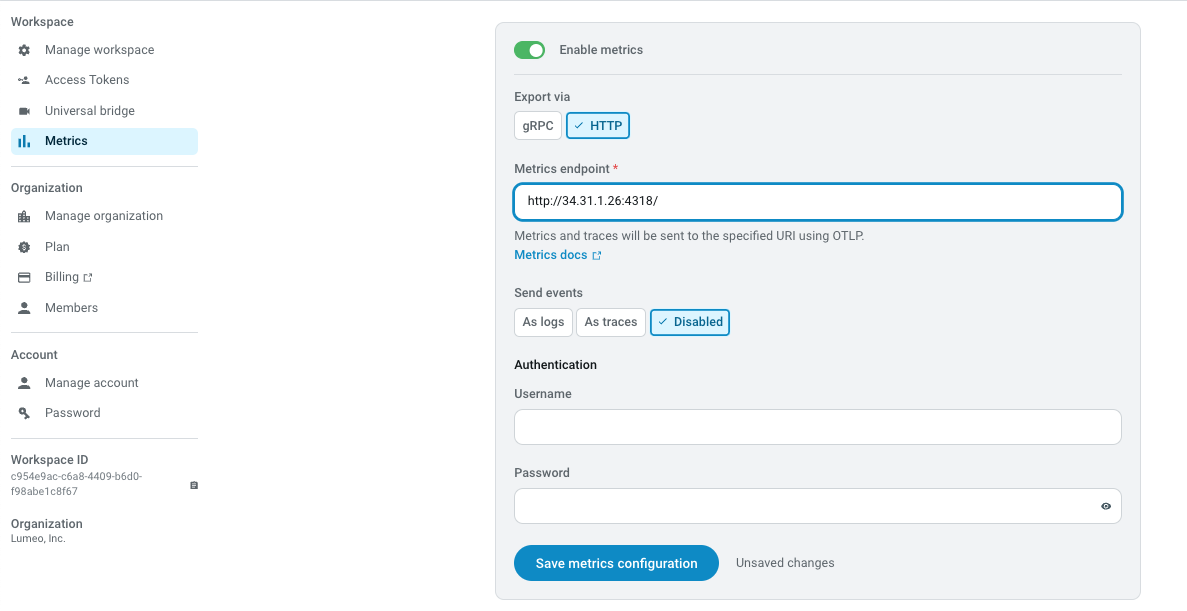
OTLP GRPC Endpoint Configuration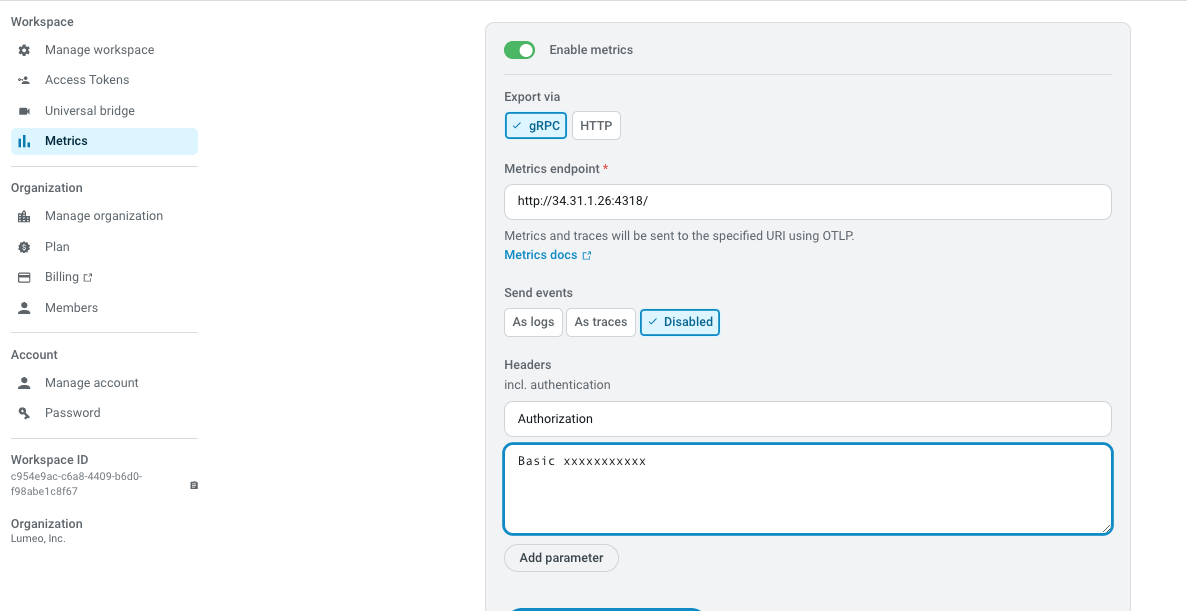
To verify that the setting has been sent to the gateway(s), visit Monitor -> Events section in Console. You will see the configuration events for each gateway that the configuration was successfully applied to.
Verify Metrics settings were applied by looking for 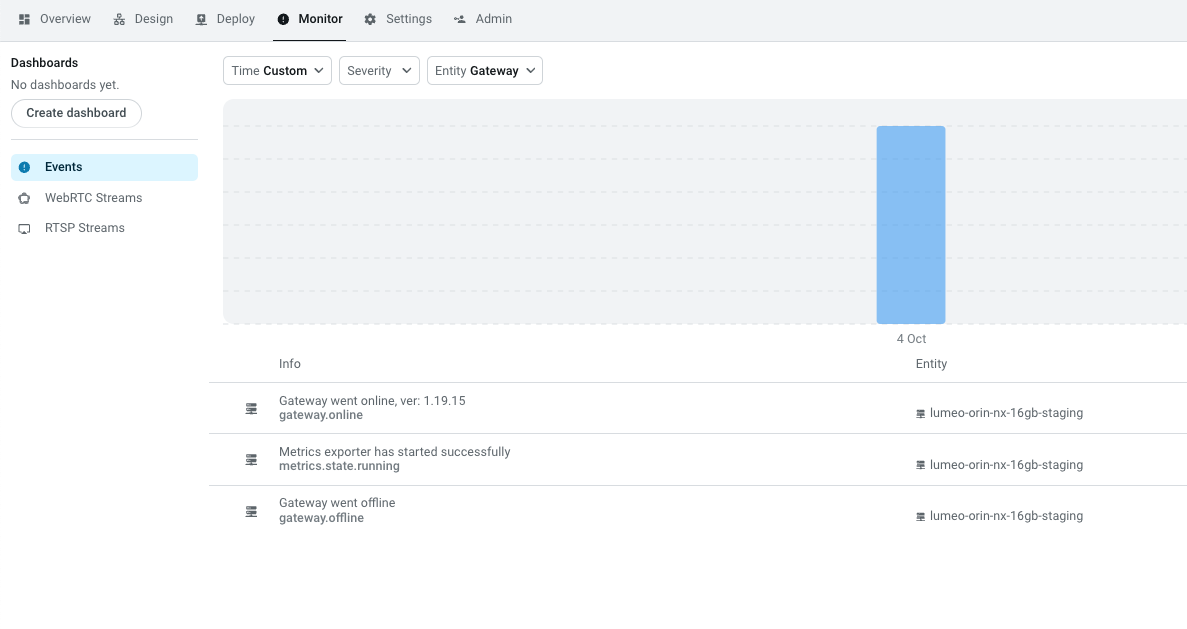
metrics.state.running events.
Observability Software
This section contains a few examples of Observability software and how to set them up. Note that this is just a sample -- Lumeo supports any software that can accept metrics using OTLP HTTP or GRPC protocols.
NewRelic
This example below uses NewRelic as the observability software to view the Metrics. See NewRelic documentation for how to obtain the Metrics endpoint and configuration.

To verify that the setting has been sent to the gateway(s), you will see on the Event selection under Monitor menu option to display the configuration events for each gateway that the configuration was successfully applied to.

When query, reporting and/or creating dashboard of the data, Lumeo also provides the following dimensions to filter/report on your data.
- Application Id
- Deployment Id
- Gateway Id
- Pipeline Id
See example of FPS from output frames across 4 deployments in NewRelic.

BindPlane
BindPlane is an open source observability pipeline that gives you the ability to collect, refine, and ship metrics, logs, and traces to any destination.
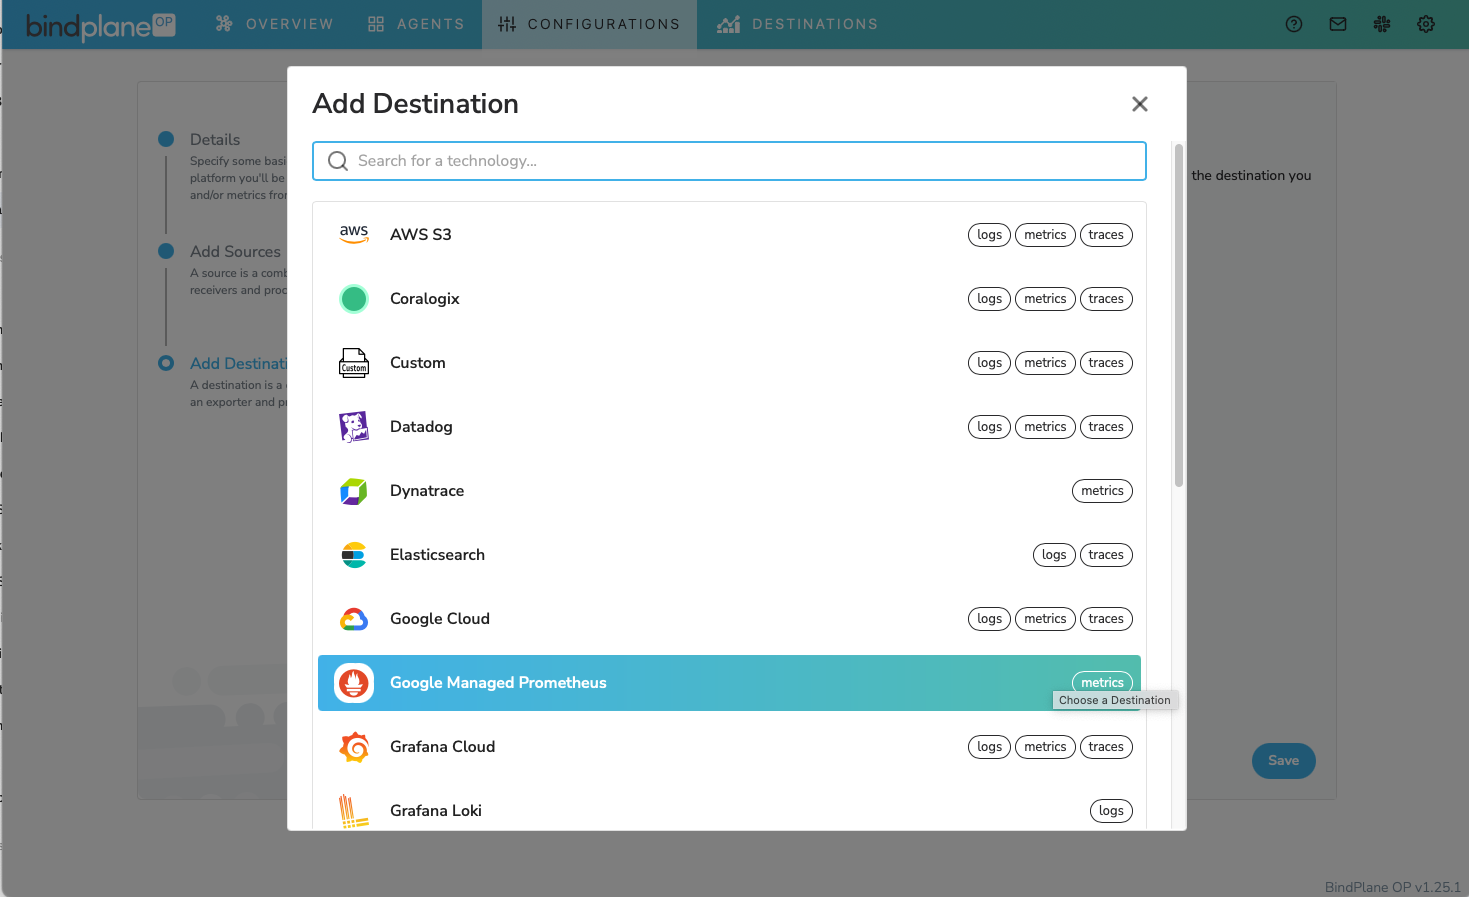
To send metrics to BindPlane, first create a BindPlane configuration that specifies OTLP as a Source and the specific Destination you wish to send metrics to.
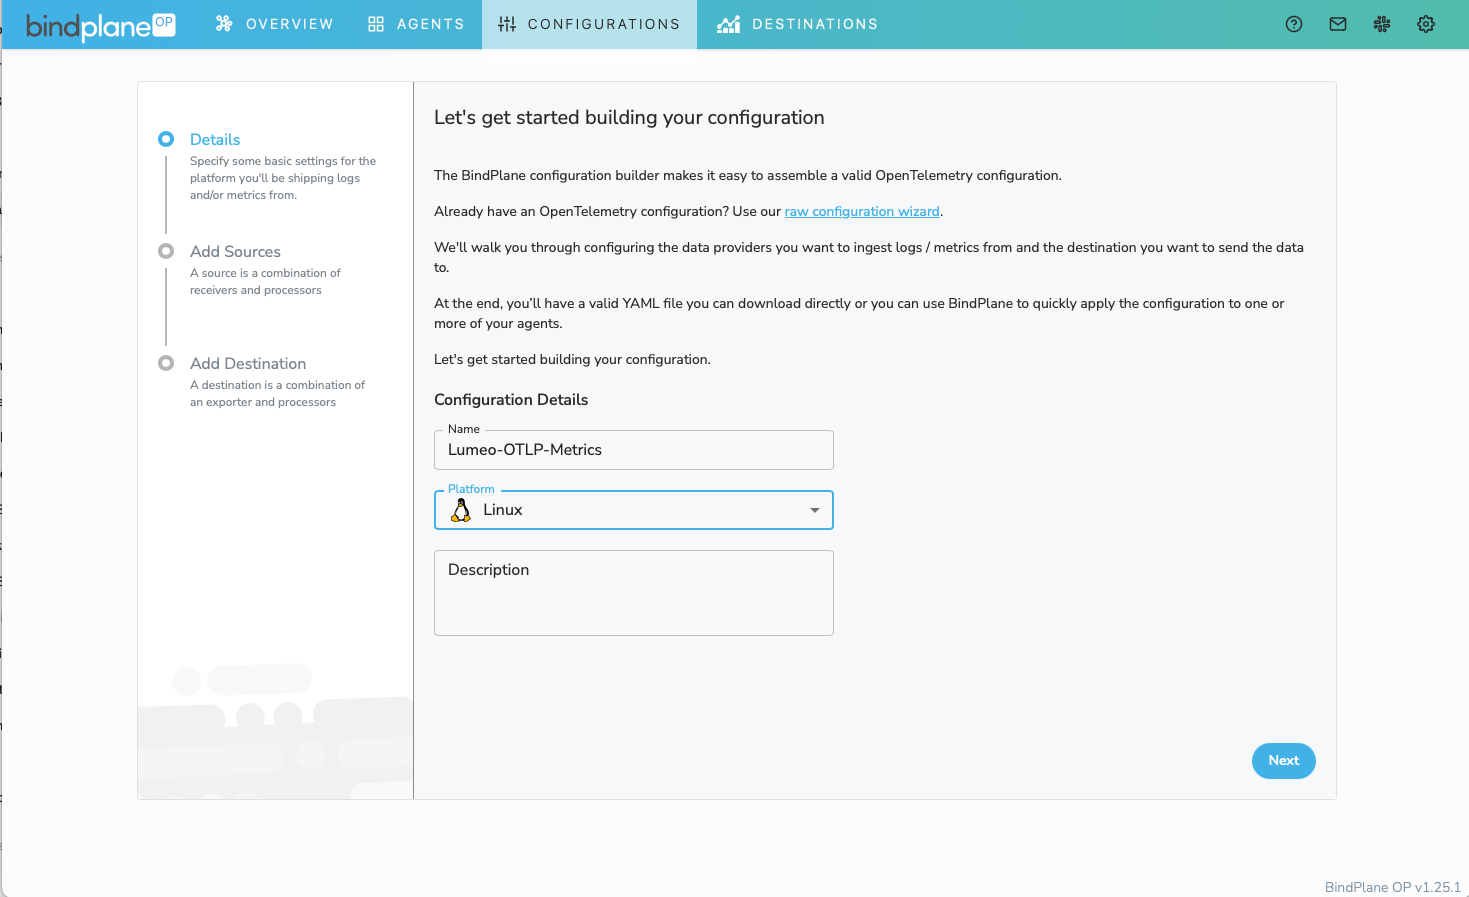
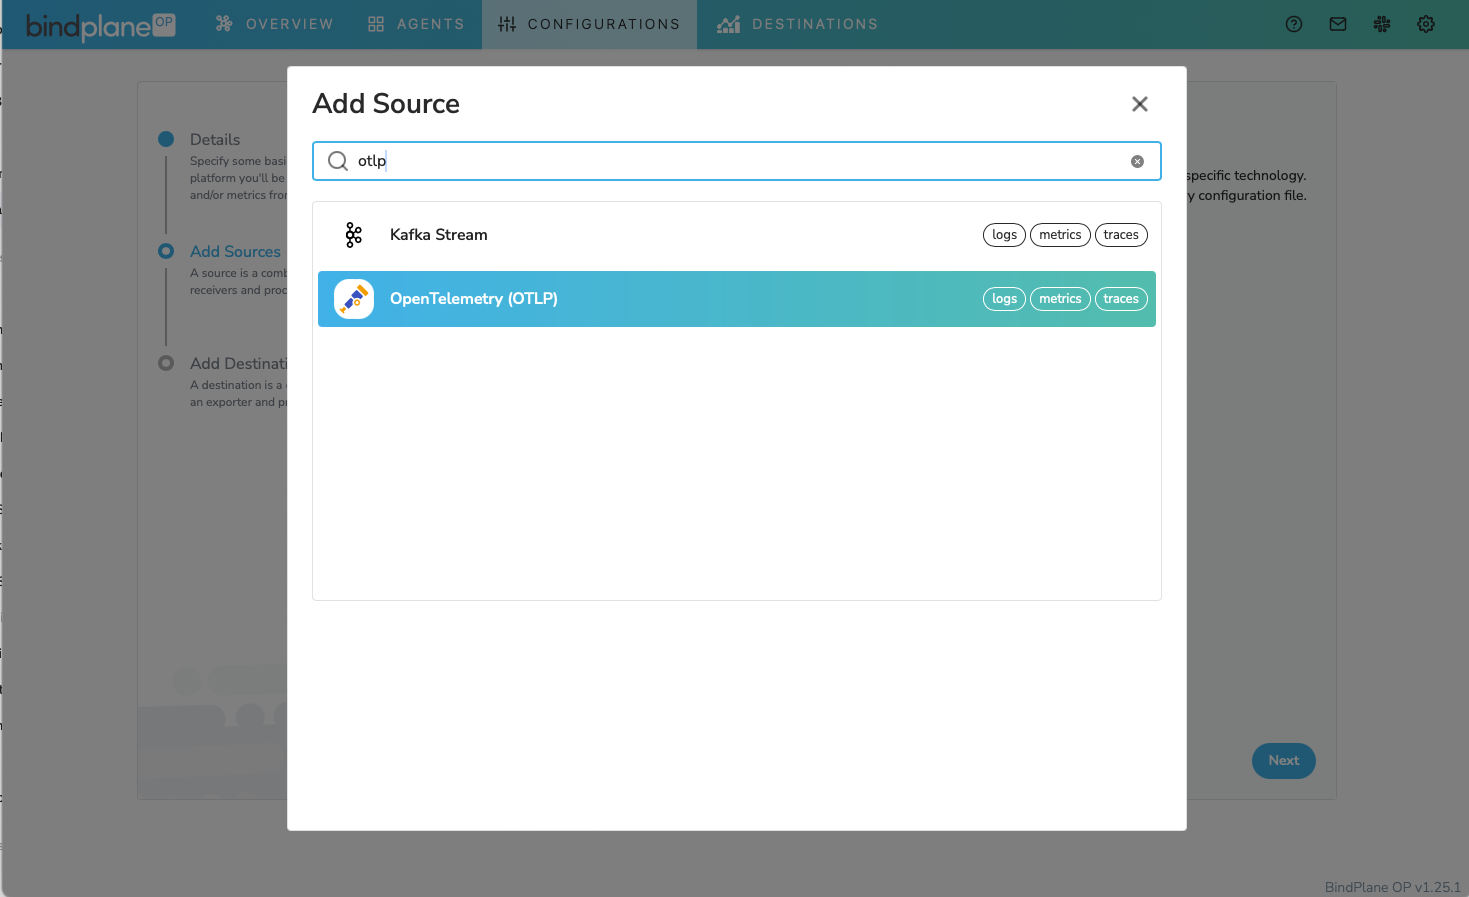
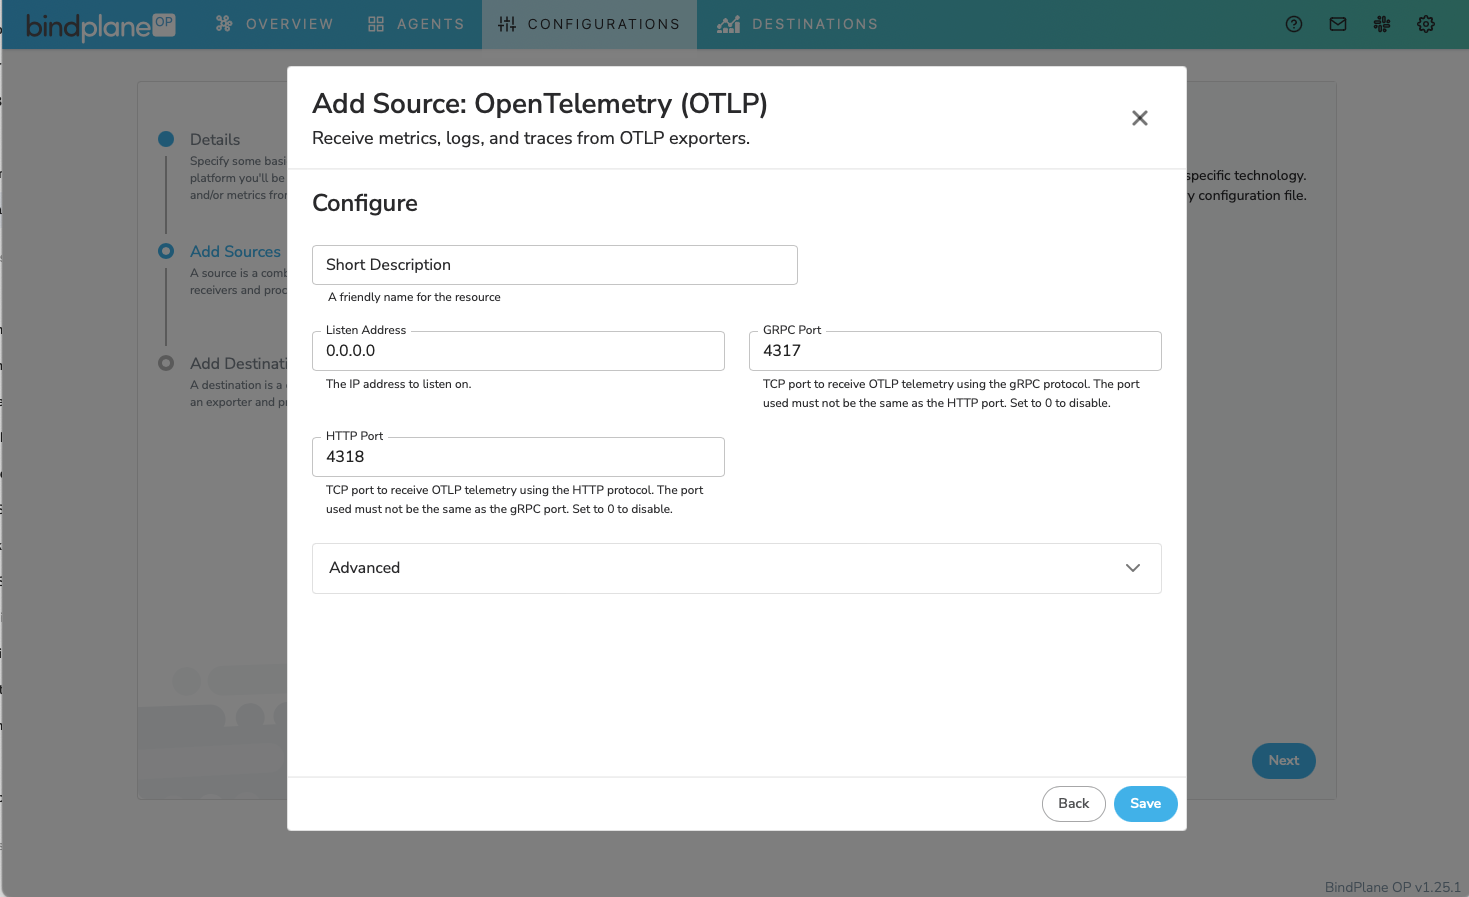
Then, assign the Configuration to a Bindplane agent.
You can now specify the OTLP endpoint in Lumeo settings as : http://<bindplane-host-ip>:4317 (GRPC) or http://<bindplane-host-ip>:4318(HTTP)
Updated 11 months ago